
 TrafficTriage
Search Console Clicks Dropped Two Weeks in a Row, Down 29%
By Ugur Saritepe · October 28, 2026
Clicks on a site I run fell 29% in a week, twice in a row. The answer changed sign when I moved the comparison off the recent peak: down 217 clicks against last week, up 25 against the last ordinary week before it. Here is the sequence, and what each step returned.
The number that started it
game-scout.app is my games site, and a weekly script compares its Search Console figures with the week before. On 26 September 2026 it reported this, for 15 to 21 September against 8 to 14 September:
                  Sep 15-21    Sep 8-14    change
clicks                  529         746      -29.1%
impressions          32,596      39,083      -16.6%
CTR                   1.62%       1.91%    -0.29 pt
avg position           9.32        9.49      better
Clicks and impressions both down is the shape Google's own traffic-drop guide tells you to work through its cause list: an algorithmic update, a seasonal pattern, a site-wide technical fault, or a reporting glitch. The last line does not fit any of them. Average position got better in the week clicks fell by a third. That contradiction is what made me widen the window before touching anything.
This is what I typed at the time:
Lets start checking from one by one. This is not first week of decrease. Its been decreasing for two weeks and we need to act. lets first think about what would be causes and what is the textbook debugging. Which things we need to check first. Lets brainstorm
Step one: widen the window before you diagnose anything
Google's first instruction is to set the date range to the full 16 months, so an annual pattern cannot be mistaken for a collapse. I did that and found no season. I found something else: the week I had been comparing against was not normal either.
week                     clicks   impressions
Aug 17-23 (pre-spike)       520        26,590
Aug 31-Sep 6 (peak)         891        42,034
Sep 7-13                    785        40,486
Sep 14-20                   562        32,762
Sep 18-24 (current)         545        35,814
Daily clicks averaged about 75 for the twelve days to 28 August, 121 across the sixteen days from 29 August to 13 September, and 78 in the current week. Nothing shipped on 29 August that could explain the jump. Two weeks of "decline" were a 16-day run of unusually good days ending, measured from its own top.
The same drop, measured against the pre-spike week
Here are the current seven days, 18 to 24 September, against 17 to 23 August, the last week before the run began. Both are whole weeks, so weekday mix cannot move the comparison:
                  Sep 18-24    Aug 17-23    change
clicks                  545          520       +4.8%
impressions          35,814       26,590      +34.7%
CTR                   1.52%        1.96%    -0.44 pt
avg position           9.06         9.27      better
At site level there is no loss to explain. There is a different fact to explain: impressions grew 35% while clicks grew 5%, so the site is being shown far more often for roughly the same number of visits. That is a click-through problem in newly ranking pages, not a fall. It is also the only genuinely bad news in the whole pull, and the week-over-week view had buried it.
Step two: sort the pages by click difference
Google's next instruction is to sort the Pages table by clicks difference, because site-wide, a group of pages, and one page are three different problems. Against the pre-spike week, the top movers were:
page                        clicks now / then   position now / then
best-detective-games                 49 / 107        8.19 / 7.13
best-lego-games                       24 / new       9.21 / new page
best-cleaning-chore-games             55 / 44        7.09 / 6.83
best-samurai-games                    18 / 8         8.66 / 8.88
best-police-games                     21 / 13        7.44 / 7.47
best-trucking-games                   43 / 37        7.32 / 6.65
One page lost 58 clicks and slid a full position. Everything else nets positive, mostly from pages that did not exist in August. The site total of plus 25 clicks is two opposite movements cancelling each other out, and only the page table shows that. The rows above are the biggest movers from a 25-row pull of 33 rows, so they are the top of the list rather than the whole site.
Step three: devices, and why the average position misled me
Splitting the same two weeks by device located 187 of the 217 lost clicks on mobile. What matters more is what mobile average position did while that happened. Across the site, mobile average position was flat, 8.65 to 8.60. On the page that lost the clicks, mobile position went 5.14 to 7.28.
Average position is weighted by impressions and pooled across every page and query you have. When a page loses its top slots, the good positions it was contributing leave the average with it, and newly ranking pages add their own deeper rows in its place. The average can hold steady, or improve, while the thing you care about is falling. Google states the consequence plainly: absolute position is the wrong success metric, and impressions and clicks are the right ones. I have written about what the average position number is actually averaging separately, from four pages on the same site.
Step four: the technical checks, which returned nothing
With one page identified, Google's guide sends you to URL Inspection. On 27 September it returned a clean sheet for that page:
verdict           PASS
coverageState     Submitted and indexed
robotsTxtState    ALLOWED
pageFetchState    SUCCESSFUL
canonical         matches the declared one
lastCrawlTime     2026-09-17 15:21 UTC
Indexed, crawlable, canonical agreed, and Google's own last fetch of the page succeeded. There is nothing here to fix, which is a real outcome and not a failed investigation. The same was true the last time my indexed page count fell.
One trap is worth naming, because it nearly sent me the wrong way. Every scripted request to my site was being answered with an HTTP 429 and a security-checkpoint page:
curl -sI https://game-scout.app/robots.txt

HTTP/2 429
x-vercel-mitigated: challenge
That is Vercel's Attack Mode, which sits under Bot Management in the project firewall. Vercel documents that known bots including Googlebot are allowed through unchallenged, and that other automated services may not be able to pass the challenge. The URL Inspection result above confirms the Googlebot half from Google's side. But every unverified fetcher sees a site that looks down: third-party SEO crawlers, uptime checks, and AI assistants that fetch pages themselves. If I had diagnosed this drop with an external crawler instead of Search Console, I would have spent the week on a blocking problem that was not blocking Google. I found this on 23 September and it was still returning 429 when I checked again on 27 September, so this is a thing I have not fixed rather than a thing I fixed. A 403 or 429 that only tools see is its own diagnosis.
What was left, and what I decided
After four steps the problem had shrunk from "the site is losing traffic" to one page losing head-query rank on mobile, starting 15 September. Two things overlap that date, and I cannot separate them with the data I have. Search Engine Roundtable reported a spike in ranking volatility on the morning of 15 September, and no Google update was confirmed behind it. Separately, a database timeout on my own site let a handful of list pages cache with missing content for up to a day on 13, 15 and 16 September, which my own change tracker caught and a fix closed on 17 September. URL Inspection reports only the last crawl, so whether Google fetched a thin version inside that window is neither shown nor ruled out. The second half of that fix, which would make those pages fail loudly instead of caching an empty one, is still not shipped as I write this.
The first answer I got about what to do was wrong, and the correction is the useful part. The reading was that the page had no review content to set it apart from the commercial listing pages above it, based on a search of the page that only reached the top strip. I knew better, because I built it:
we have review text on every list page and in details we have pros and cons
That was right, and the earlier reading was withdrawn. Every entry on the page renders a rating with a review count, a sentiment badge, a review-analysis paragraph and a short take. The correction moves the diagnosis in a useful direction: if the content advantage was already live while the page fell from position 3 to outside the top ten, content is not what moved. What is left is narrow, and freshness is the visible part of it: the page still declares "Updated Jul 17, 2026", which was more than two months stale when I read it on 26 September.
Then the question that decides the next fortnight of work:
Does it make sense to start on this page or should we start working on our worst pages first ?
Start with the page that lost, not the worst pages. That page takes roughly 1,500 to 2,800 impressions a week, so a one-slot move shows up in days. The worst pages take 20 to 100 a week, where three weeks of data cannot separate a real move from noise. You would finish the test and still not know. I have not requested indexing for the page either, because its position was still moving and I did not want to stack changes on a page mid-read.
Where it stands on 27 September
This is the honest ending, because the page has not recovered and has not kept falling. Its daily average position:
Sep 8-14    6.51  6.46  6.18  6.55  6.12  6.07  6.34
Sep 15-21   6.70  7.48  8.63  7.63  7.75  8.83  9.65
Sep 22-24   8.59  8.31  7.96
It turned on 21 September and has come back to about 8, against the 6.1 to 6.5 band it held before. Daily clicks are 2 to 5, against 20 to 34 before. Google has not recrawled it since 17 September. The read is incomplete on purpose: the next useful number comes from waiting, not from editing.
The sequence to run on your own site
Stop at the first step that gives you a real answer. Steps 1 and 2 take about five minutes each and settle most cases.
- Set the date range to 16 months. You are looking for one thing: whether the level you are comparing against is ordinary. A spike, a launch, or a season before the fall means your baseline is wrong.
- Compare the last whole week against the last ordinary week. Whole weeks only, so weekday mix cannot move it. Up or flat means the fall is a return to trend; down means keep going.
- Sort the Pages table by clicks difference. Site-wide goes to the Page Indexing report. A group of pages or a single page goes to URL Inspection on samples.
- Split by device, then by country. Do this before reading any average position. A per-page position that moved while the site average held is the normal case, not an anomaly.
- Run URL Inspection on the pages that actually lost. Coverage state, robots state, fetch state, and whether Google's chosen canonical is the URL you expect.
- If all of that is clean, it is a ranking question. Look at the live results for the queries that lost, on the device that lost. Nothing in your codebase will tell you a competitor took slot three.
To verify you read it right, re-pull the same two windows a week later without changing anything. If the gap has closed on its own, it was volatility and your baseline was the whole story. If the same pages are still down, you have a ranking problem with a clean technical sheet, and now you know which pages to spend the effort on.
The two calls that did the work
I run these pulls by asking, because the useful comparisons are the awkward ones: two explicit windows that are not "previous period", split by page, then by device. In Search Console that is a lot of clicking, and the numbers land in different tabs. One sentence names the property, the two ranges and the dimension, and the rows come back together:
totals   545 clicks / 35,814 impr / pos 9.06
compare  520 clicks / 26,590 impr / pos 9.27
best-detective-games   49 / 107 clicks   pos 8.19 / 7.13
The same question again with the device dimension, and the mix effect was visible in one line. Both pulls together took under a minute, which matters when the alternative is deciding from the first number you saw. The same approach works for one page after an edit, where the baseline problem is the change date rather than a spike. The rest of the Search Console symptoms are diagnosed the same way: read what the report says before deciding what it means.
- All numbers here: game-scout.app, pulled 27 September 2026, Search Console data complete through 24 September. One site, one incident.
- Not claimed: that a Google update caused this. Google confirmed no core update in September 2026, and the 15 September date is a coincidence I can point at, not a cause I can prove.
FAQ
Why did my Search Console clicks drop?
Before looking for a cause, check which week you are comparing against. On my own site clicks fell 29% against the previous week and rose 5% against the last normal week before an unusual run, from the same data. Once the baseline is right, sort the Pages table by click difference: a site-wide fall and one page falling while the rest hold are different problems with different fixes.
Why do my clicks drop while average position improves?
Average position is weighted by impressions across all your pages and queries, so it is a mix, not a rank. When a page loses its top slots, the good positions it contributed leave the average with it, and newer pages ranking deeper add their own rows. On my site clicks fell 29% in the same week the site average moved from 9.49 to 9.32. Google says outright that absolute position is the wrong success metric and that impressions and clicks are the ones to read.
How do I tell a real traffic drop from normal fluctuation?
Widen the date range to 16 months first, so a spike or a season cannot be mistaken for a baseline. Then compare the current seven days against the last seven-day stretch that looked ordinary, using whole weeks so weekday mix cannot move the number. If the current week is at or above that level, the fall is a return to trend, and the work is to find the pages that genuinely lost, not to change the site.
Should I change the page that lost rank?
Not immediately. Google recommends not making radical changes to a page that was performing well, because a small position drop is normal fluctuation and recovery can take weeks. I left the page that lost 58 clicks alone while its daily position was still moving, so that the next read would mean something instead of measuring my own edits.
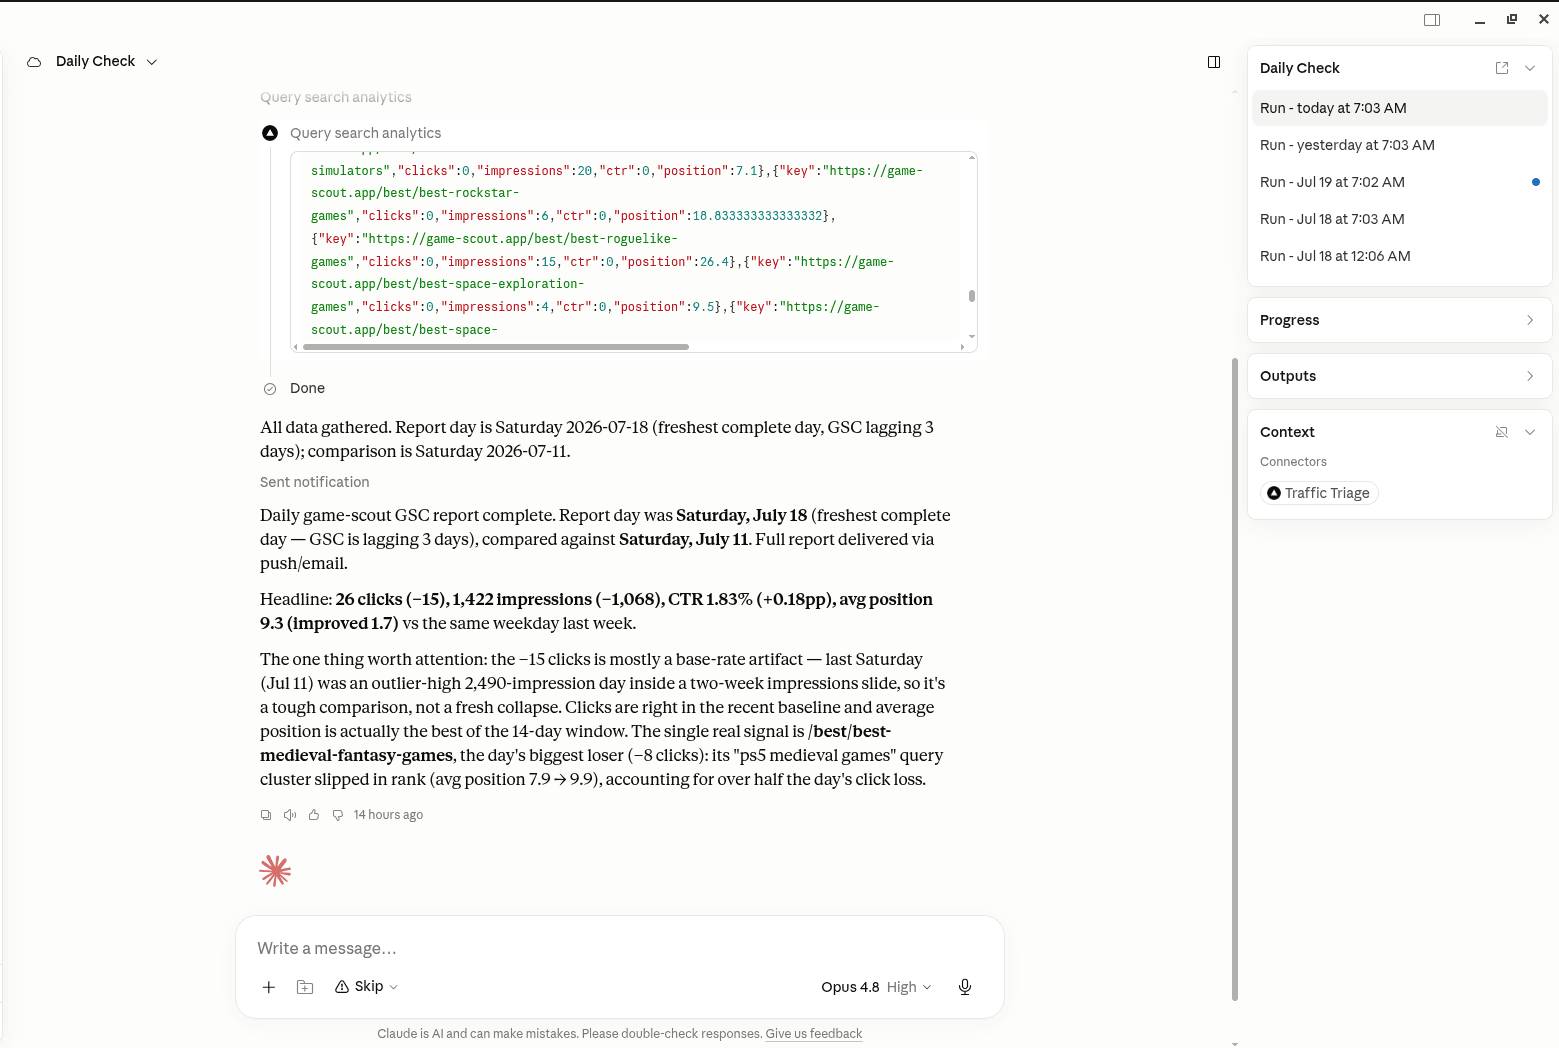
Ask for the two-window comparison instead of building it. Create a free account and the MCP server lets your assistant pull any two date ranges from your own Search Console with query_search_analytics, segmented by page and device, so you can see whether your drop is a baseline artefact before you change a line of your site.
In your AI assistant
Ask your AI about your own site
TrafficTriage plugs into Claude, Cursor, and ChatGPT. Your assistant runs the 8 checks, reads your Search Console data, and can even check your site every morning. Free account, no API key, nothing to install.